Bhutan – Exports
What is the composition of Bhutan exports ?
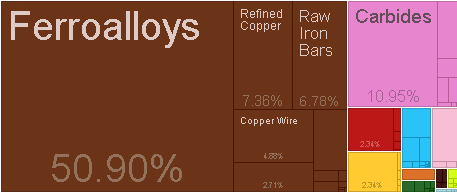
What are the top exports of Bhutan ?
| Sr | Code | Country Name | Value of Imports | Percent of total |
| 1 | 7202 | Ferroalloys | $92,986,093.15 | 51% |
| 2 | 2849 | Carbides | $20,005,316.43 | 11% |
| 3 | 7403 | Refined Copper | $13,451,395.07 | 7.40% |
| 4 | 7214 | Raw Iron Bars | $12,392,401.02 | 6.80% |
| 5 | 7408 | Copper Wire | $8,913,036.00 | 4.90% |
| 6 | 7206 | Iron Ingots | $4,944,520.00 | 2.70% |
| 7 | 4410 | Particle Board | $4,283,240.12 | 2.30% |
| 8 | 1001 | Wheat | $4,272,714.89 | 2.30% |
| 9 | 7207 | Semi-Finished Iron | $4,217,023.34 | 2.30% |
| 10 | 3920 | Raw Plastic Sheeting | $3,011,733.66 | 1.60% |
| 11 | 2836 | Carbonates | $2,457,957.43 | 1.30% |
| 12 | 8418 | Refrigerators | $1,869,212.00 | 1.00% |
| 13 | 8481 | Valves | $945,962.00 | 0.52% |
| 14 | 6802 | Building Stone | $873,708.55 | 0.48% |
| 15 | 2833 | Sulfates | $799,643.01 | 0.44% |
| 16 | 8414 | Air Pumps | $588,517.00 | 0.32% |
| 17 | 7227 | Steel Bars | $586,966.83 | 0.32% |
| 18 | 2815 | Sodium or Potassium Peroxides | $583,971.81 | 0.32% |
| 19 | 7218 | Stainless Steel Ingots | $514,674.86 | 0.28% |
| 20 | 3820 | Antifreeze | $479,439.67 | 0.26% |
What are the top markets for Bhutan ?
| Sr | Code | Country Name | Value of Imports | Percent of total |
| 1 | IND | India | $161,197,569.97 | 88% |
| 2 | NGA | Nigeria | $11,351,005.20 | 6.20% |
| 3 | ITA | Italy | $3,108,668.43 | 1.70% |
| 4 | JPN | Japan | $2,052,359.41 | 1.10% |
| 5 | DEU | Germany | $1,338,186.63 | 0.73% |
| 6 | ESP | Spain | $571,131.00 | 0.31% |
| 7 | USA | United States | $538,531.41 | 0.29% |
| 8 | THA | Thailand | $340,607.05 | 0.19% |
| 9 | CHE | Switzerland | $335,009.74 | 0.18% |
| 10 | BGR | Bulgaria | $263,306.31 | 0.14% |
| 11 | NLD | Netherlands | $211,937.94 | 0.12% |
| 12 | AUS | Australia | $196,012.90 | 0.11% |
| 13 | GBR | United Kingdom | $161,744.45 | 0.09% |
| 14 | UKR | Ukraine | $149,330.69 | 0.08% |
| 15 | COL | Colombia | $141,977.78 | 0.08% |
| 16 | FRA | France | $136,008.20 | 0.07% |
| 17 | PAK | Pakistan | $114,178.88 | 0.06% |
| 18 | BLX | Belgium-Luxembourg | $88,211.00 | 0.05% |
| 19 | AUT | Austria | $63,071.05 | 0.04% |
| 20 | CAN | Canada | $50,314.63 | 0.03% |
Statistics sourced from The Observatory of Economic Complexity.
Bhutan continues to strengthen its local production capabilities, and diversify its export markets.
Are you looking to source products from Bhutan? Need guidance and linkages to export sources. Click here to send your questions.
![]()