Jordan – Exports
What is the composition of Jordan exports ?
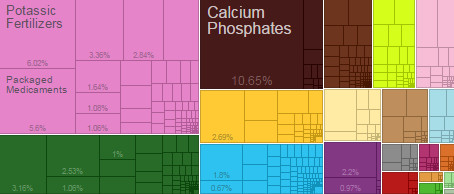
What are the top exports of Jordan ?
| Sr | Code | Country Name | Value of Imports | Percent of total |
| 1 | 2510 | Calcium Phosphates | 956546988.1 | 0.11 |
| 2 | 3104 | Potassic Fertilizers | 541036036.5 | 0.06 |
| 3 | 3004 | Packaged Medicaments | 503135357.8 | 0.056 |
| 4 | 3105 | Mixed Mineral or Chemical Fertilizers | 301742487.5 | 0.034 |
| 5 | 6110 | Knit Sweaters | 284221331.4 | 0.032 |
| 6 | 3003 | Unpackaged Medicaments | 255439706.7 | 0.028 |
| 7 | 702 | Tomatoes | 241584070.1 | 0.027 |
| 8 | 6204 | Non-Knit Women’s Suits | 227302204.6 | 0.025 |
| 9 | 3102 | Nitrogenous Fertilizers | 219289248.6 | 0.024 |
| 10 | 7108 | Gold | 197429866.1 | 0.022 |
| 11 | 8544 | Insulated Wire | 161763467.4 | 0.018 |
| 12 | 2809 | Phosphoric Acid | 147234276.7 | 0.016 |
| 13 | 104 | Sheep and Goats | 144515706.4 | 0.016 |
| 14 | 3901 | Ethylene Polymers | 108808489.7 | 0.012 |
| 15 | 809 | Pitted Fruits | 103664648 | 0.012 |
| 16 | 2709 | Crude Petroleum | 100170964.4 | 0.011 |
| 17 | 2834 | Nitrites and Nitrates | 96677836.39 | 0.011 |
| 18 | 2801 | Halogens | 94971077.86 | 0.011 |
| 19 | 6105 | Knit Men’s Shirts | 94945631.15 | 0.011 |
| 20 | 3923 | Plastic Lids | 93105447.54 | 0.01 |
What are the top markets for Jordan ?
| Sr | Code | Country Name | Value of Imports | Percent of total |
| 1 | IRQ | Iraq | 1206545880 | 0.13 |
| 2 | USA | United States | 1165727578 | 0.13 |
| 3 | IND | India | 1090709950 | 0.12 |
| 4 | SAU | Saudi Arabia | 765310285 | 0.085 |
| 5 | Free Zones | 760235727 | 0.085 | |
| 6 | LBN | Lebanon | 342251669 | 0.038 |
| 7 | ARE | United Arab Emirates | 315999346 | 0.035 |
| 8 | IDN | Indonesia | 287197058.9 | 0.032 |
| 9 | CHN | China | 268465422.2 | 0.03 |
| 10 | EGY | Egypt | 222914080.6 | 0.025 |
| 11 | SYR | Syria | 218119388 | 0.024 |
| 12 | ISR | Israel | 213505596.6 | 0.024 |
| 13 | DZA | Algeria | 181671270.9 | 0.02 |
| 14 | BGR | Bulgaria | 172917011.8 | 0.019 |
| 15 | TUR | Turkey | 134162647.3 | 0.015 |
| 16 | QAT | Qatar | 115826622 | 0.013 |
| 17 | SDN | Sudan | 115190095.3 | 0.013 |
| 18 | KWT | Kuwait | 102985516 | 0.011 |
| 19 | PSE | Palestine | 86248227 | 0.0096 |
| 20 | LBY | Libya | 76830578 | 0.0086 |
Statistics sourced from The Observatory of Economic Complexity.
Jordan continues to strengthen its local production capabilities, and diversify its export markets.
Are you looking to source products from Jordan? Need guidance and linkages to export sources. Click here to send your questions.
![]()